RepoClear

Monthly Values and Graphs Update for RepoClear Ltd and RepoClear SA

RepoClear Volumes
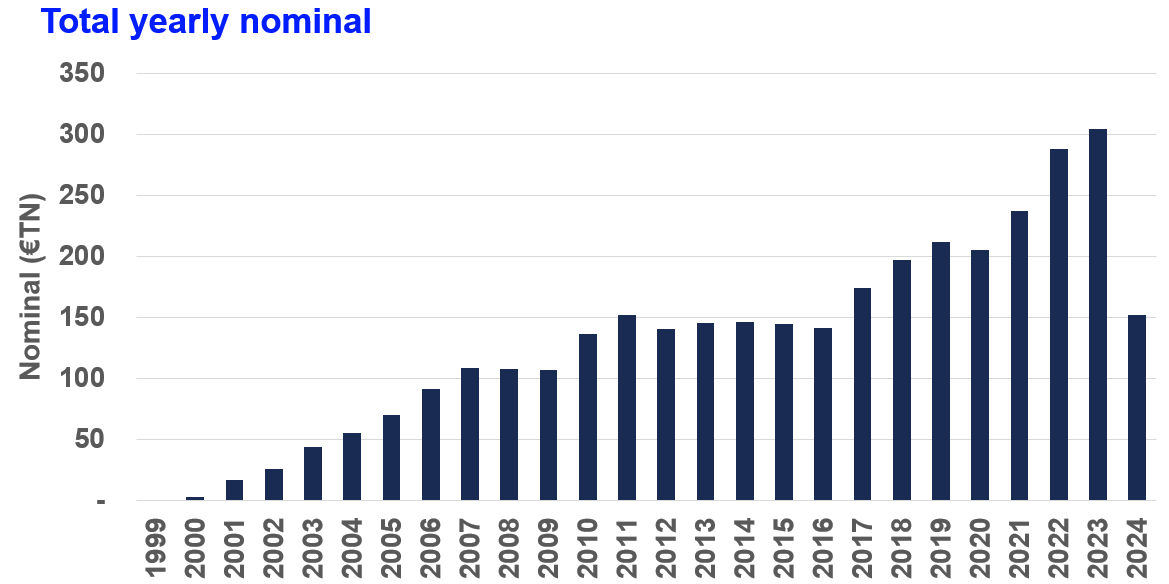
Total Yearly Nominal (in €tn)

Year

Total Total Yearly Nominal - LTD (in €tn) Total Yearly Nominal - SA (in €tn)
1999                                               0.43                                      0.43  
2000                                               2.75                                      2.75  
2001                                             17.20                                    17.20  
2002                                             25.74                                    25.74  
2003                                             44.41                                    36.34                                  8.08
2004                                             55.72                                    43.82                                11.90
2005                                             70.01                                    50.36                                19.65
2006                                             91.78                                    60.33                                31.46
2007                                           108.98                                    71.06                                37.92
2008                                           108.36                                    73.27                                35.09
2009                                           106.84                                    70.83                                36.01
2010                                           136.71                                    88.16                                48.55
2011                                           152.31                                    97.70                                54.61
2012                                           140.80                                    84.84                                55.96
2013                                           145.30                                    80.13                                65.17
2014                                           146.72                                    81.56                                65.16
2015                                           145.16                                    79.04                                66.12
2016                                           141.81                                    74.27                                67.53
2017                                           174.56                                    87.20                                87.37
2018                                           197.20                                    97.37                                99.84
2019                                           212.00                                    44.83                               167.17
2020                                           205.38                                    36.31                               169.07
2021                                           237.62                                    42.59                               195.04
2022                                           288.40                                    54.87                               233.53
2023                                             99.57                                    16.16                                 83.41
Monthly Nominal (in €tn)
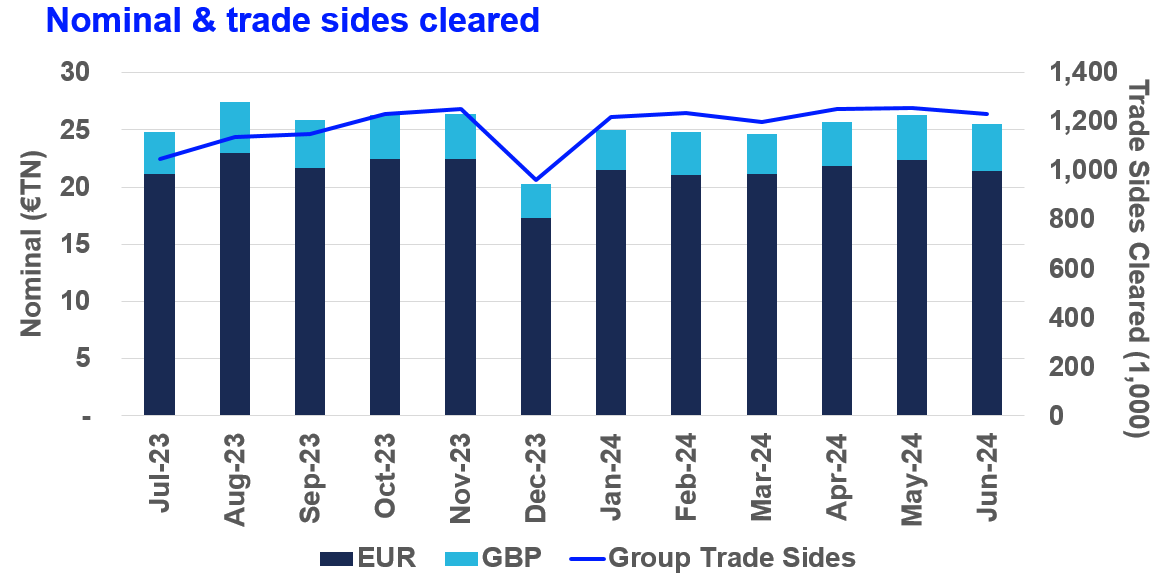
  LTD  SA
May-22                                  4.51                                  20.03
Jun-22                                  4.11                                  20.31
Jul-22                                  4.00                                  19.69
Aug-22                                  4.41                                  20.46
Sep-22                                  5.21                                  21.99
Oct-22                                  5.64                                  20.36
Nov-22                                  5.10                                  21.67
Dec-22                                  4.12                                  18.47
Jan-23                                  4.01                                  20.61
Feb-23                                  4.07                                  20.28
Mar-23                                  4.57                                  24.39
Apr-23                                  3.51                                  18.13
Monthly Cash Value (in €tn)
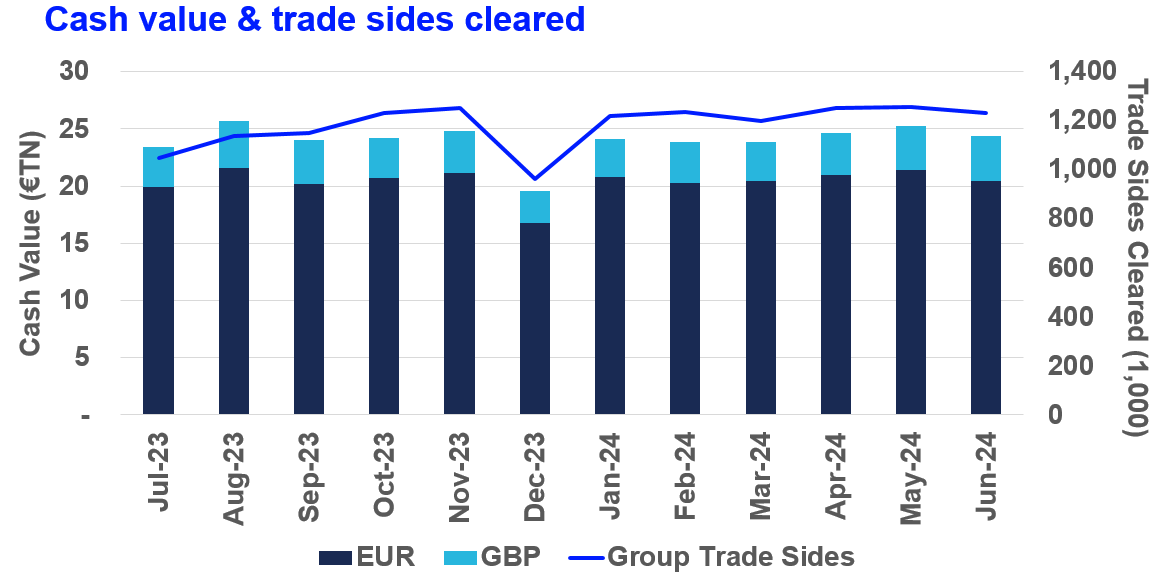
  LTD SA
May-22                              4.98                                  20.16
Jun-22                              4.40                                  19.80
Jul-22                              4.35                                  19.55
Aug-22                              4.79                                  20.46
Sep-22                              5.25                                  21.05
Oct-22                              5.45                                  19.05
Nov-22                              5.16                                  20.57
Dec-22                              4.14                                  17.68
Jan-23                              4.00                                  19.54
Feb-23                              4.05                                  19.09
Mar-23                              4.53                                  22.95
Apr-23                              3.47                                  17.11
Monthly Term Adjusted Cash Value (in €tn)
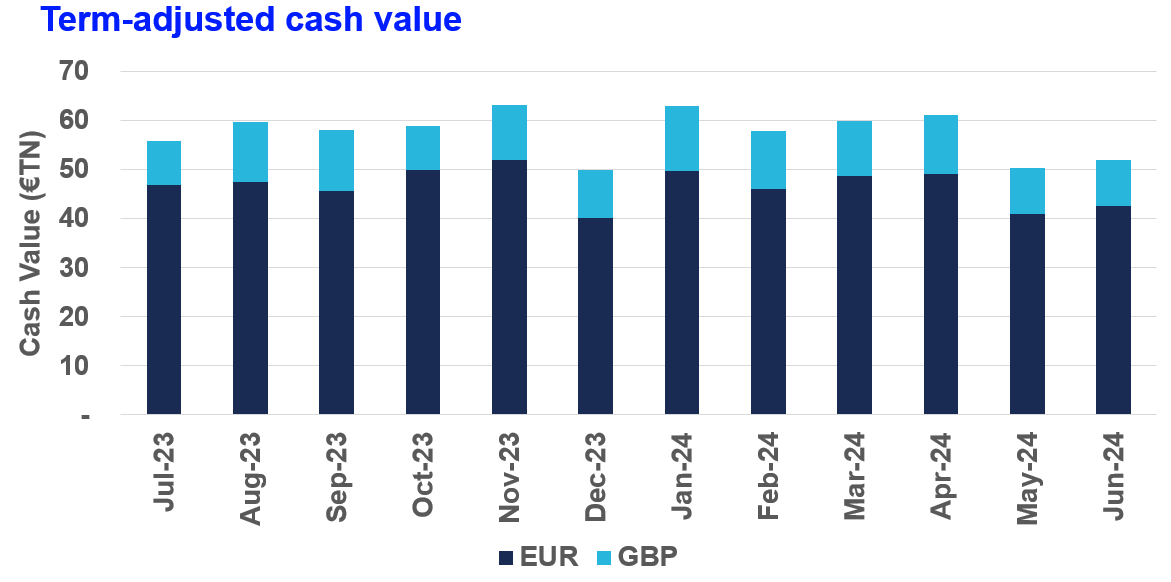
  LTD SA
May-22                             18.01                                  40.85
Jun-22                             13.94                                  43.14
Jul-22                             11.41                                  44.88
Aug-22                             12.76                                  44.67
Sep-22                             12.92                                  47.21
Oct-22                             13.95                                  45.14
Nov-22                             14.16                                  51.64
Dec-22                             12.29                                  37.84
Jan-23                             15.04                                  41.67
Feb-23                             12.48                                  40.39
Mar-23                             16.09                                  59.01
Apr-23                               9.13                                  44.48
Monthly Cleared Trade Sides
  LTD  SA
May-22                          121,858                                    927,798
Jun-22                          108,980                                    909,288
Jul-22                          110,404                                    879,168
Aug-22                          112,262                                    918,358
Sep-22                          109,416                                    943,754
Oct-22                          118,762                                    911,484
Nov-22                          126,818                                    972,646
Dec-22                          101,564                                    807,006
Jan-23                          116,458                                    979,396
Feb-23                          110,746                                    950,326
Mar-23                          131,752                                 1,105,784
Apr-23                          101,146                                    817,892
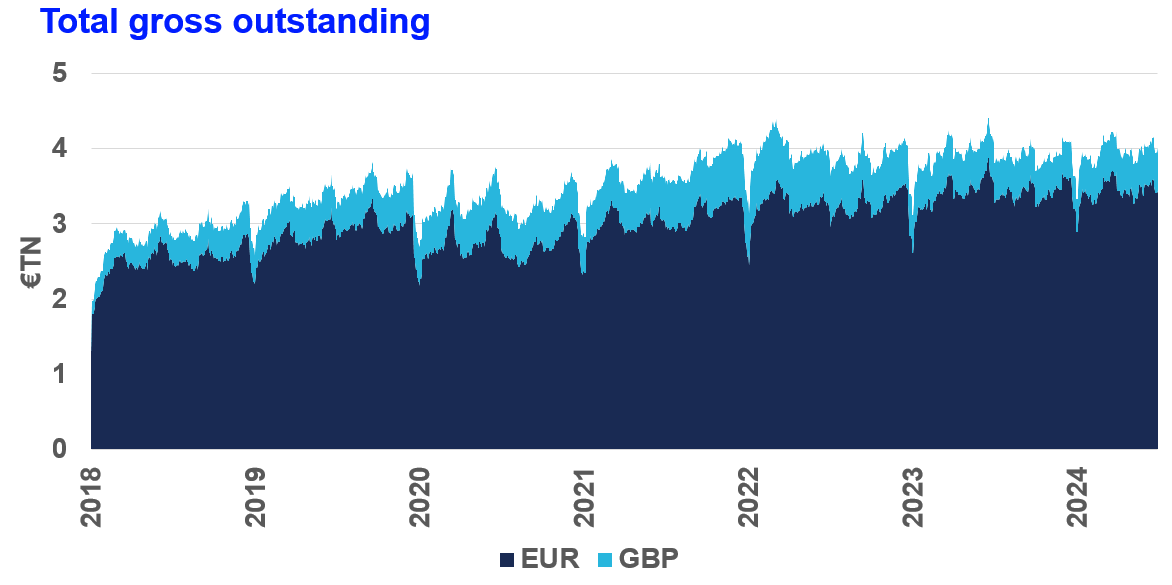
RepoClear Total Gross Outstanding (in €tn)
Total Volumes by Country of Issue

View total volumes by country of issue.

Definitions:

"Nominal" is the sum of contracts' bond nominal value cleared (double counted)

"Term Adjusted Cash Value" is the cash value multiplied by term of the trade

"Total Gross Outstanding" is calculated using the methodology of the ICMA semi-annual survey of the European repo market